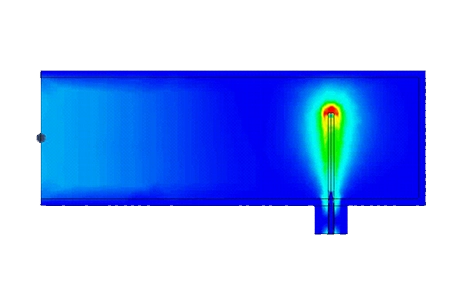
Virtually Prototyping an Eight-Way Coaxial Waveguide Power Combiner
Description
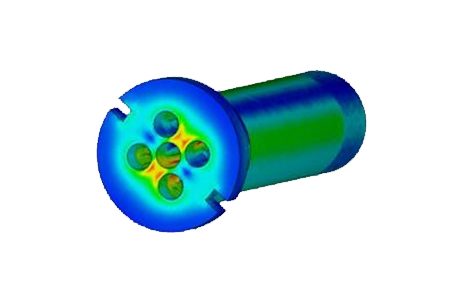
Explore our validated simulation results for an eight-way power combiner, modeled precisely after specifications in [1]. Our findings closely match the reference measurements, showcasing the accuracy of our simulation. The illustration highlights the primary input port at the structure's base and an output port.
Figure 1: the structure's 3D view (Input and one output port are indicated)
Simulation
The Scattering Parameters solver excels in analyzing structures by providing critical metrics like Return Loss, Insertion Loss, and Output Port Isolation, alongside phase shifts. It employs a finer mesh, especially near impedance matching areas and transition faces, to accurately capture changes in impedance and geometry, ensuring detailed simulations.
Loads/ Restraints
Ports are applied to the circular dielectric faces, and indicating TEM mode propagation to the solver enhances accuracy. The structure functions as a vacuum cavity with its exterior as Perfect Electric Conductor surfaces.
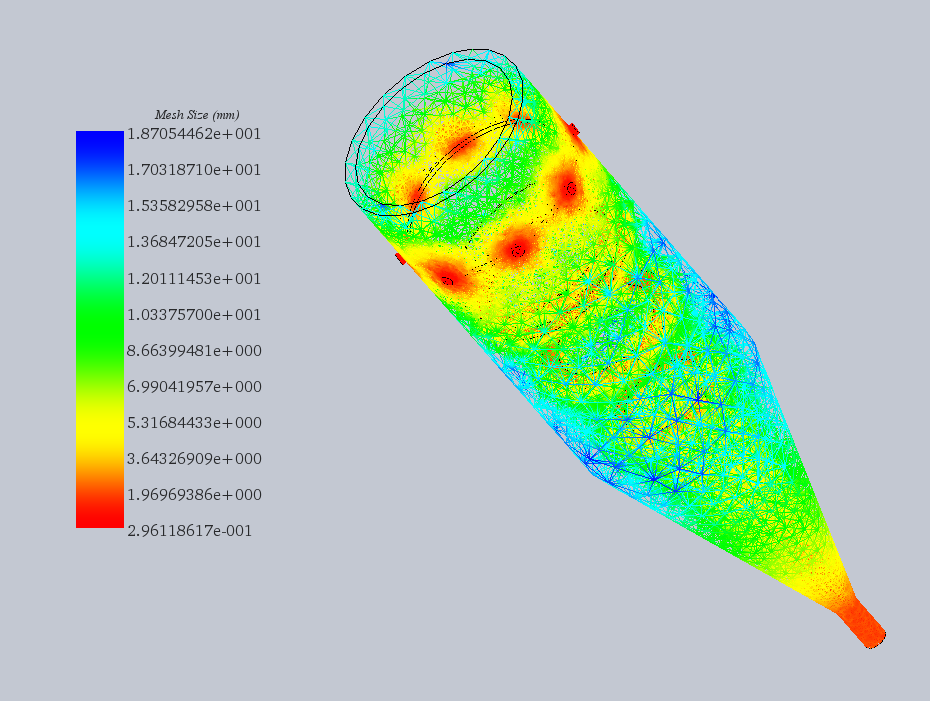
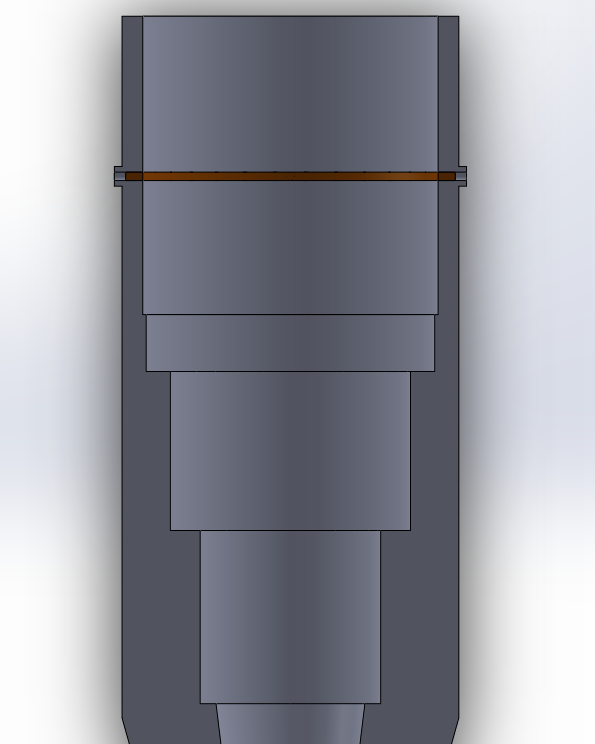
HFWorks allows 3D mesh visualization in color, offering users control to refine the mesh in critical areas, such as the stepped-impedance coaxial-line matching section
Figure 2: Colored mesh of the structure alongside the impedance matching section
Results
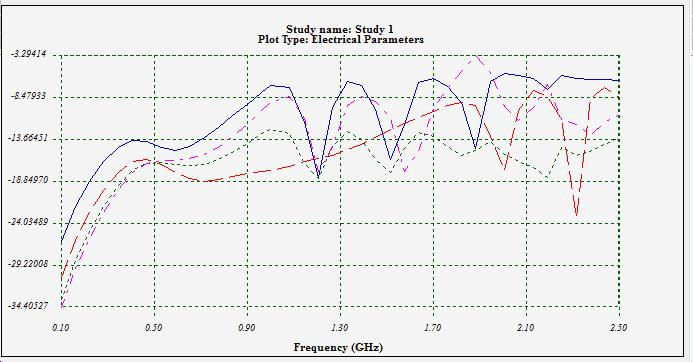
To verify the HFWorks simulator's accuracy, it's essential to compare simulation outcomes with actual measurements. The provided figures illustrate the structure's insertion and return losses across the 0.5 to 2 GHz frequency range.

Figure 3: A comparison of the simulated and measured reflection coefficients at the central output port
-a-
-b- [1]
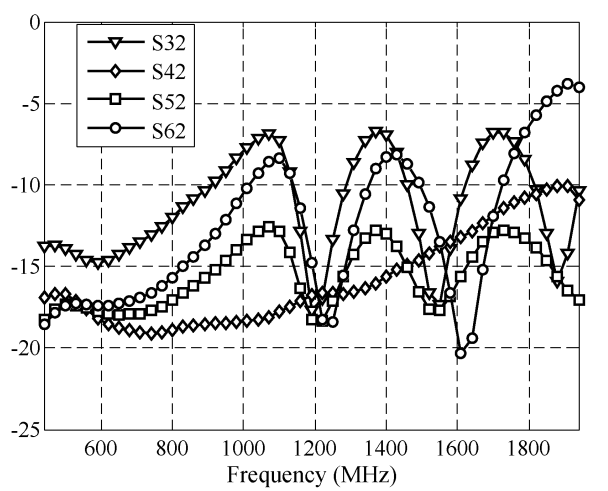
Figure 4: Isolation between the output ports (S32-Blue-, S42-Red-, S52-Green-, S62-Pink-) (a: Simulated; b: Measured)
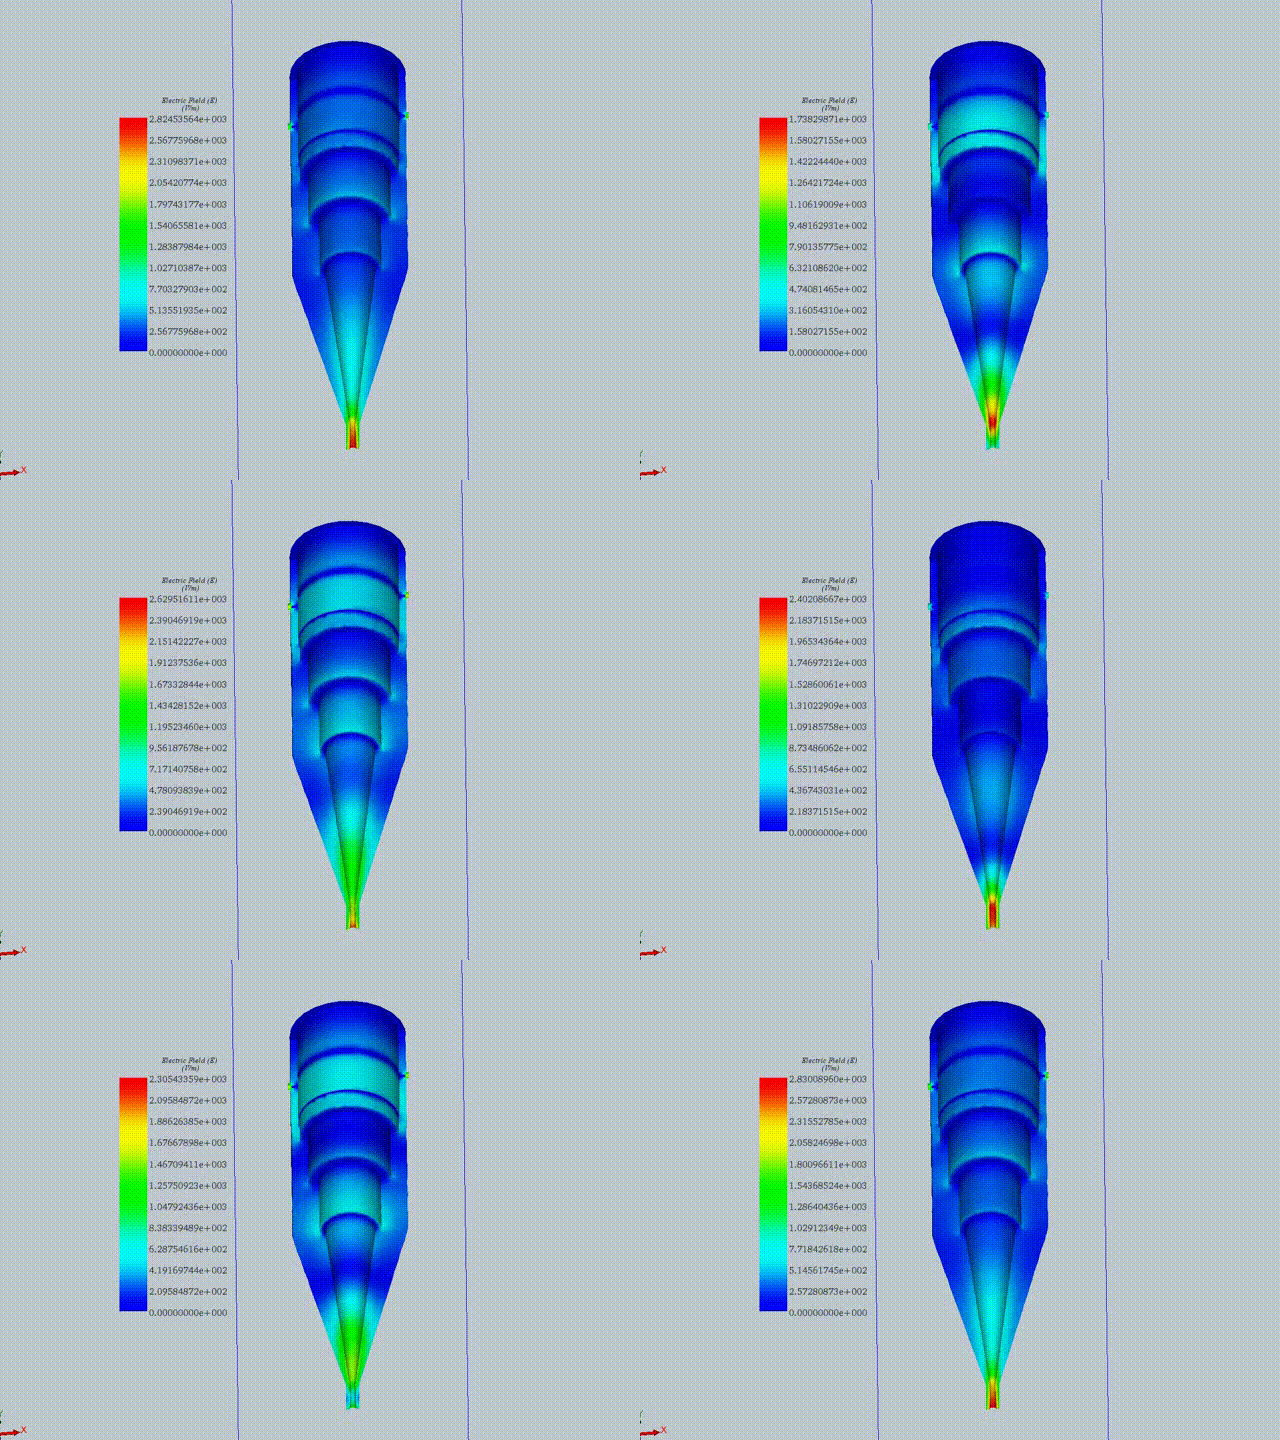
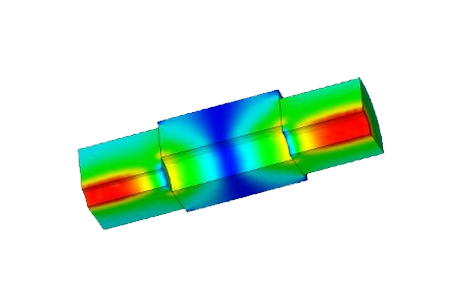
Figure 6: 3D Electric Field Distribution at 1 GHz
Conclusion
This application note presents a comprehensive validation of simulation results for an eight-way power combiner, closely aligning with the specifications and measurements outlined in the referenced literature. Utilizing HFWorks, the study meticulously models the power combiner, focusing on critical metrics such as Return Loss, Insertion Loss, and Output Port Isolation, alongside phase shifts. The simulation employs a detailed mesh, particularly around areas requiring precise impedance matching, to ensure an accurate representation of the combiner's performance across a 0.5 to 2 GHz frequency range.
The findings demonstrate the simulator's precision in capturing the combiner's characteristics, with a particular emphasis on the comparison of simulated and measured reflection coefficients and the isolation between output ports. Additionally, the study provides insights into the 3D electric field distribution at 1 GHz, further validating the simulation's accuracy. This application note underscores the effectiveness of HFWorks in simulating complex microwave structures, offering a reliable tool for engineers in designing and analyzing broadband power combiners.
References
[1] Design of a Broadband Eight-Way Coaxial Waveguide Power Combiner, Mohammad Amjadi and Eslam Jafari, IEEE TRANSACTIONS ON MICROWAVE THEORY AND TECHNIQUES, VOL. 60, NO. 1, JANUARY 2012


.PNG)
